Evolutionary Coupling Analysis
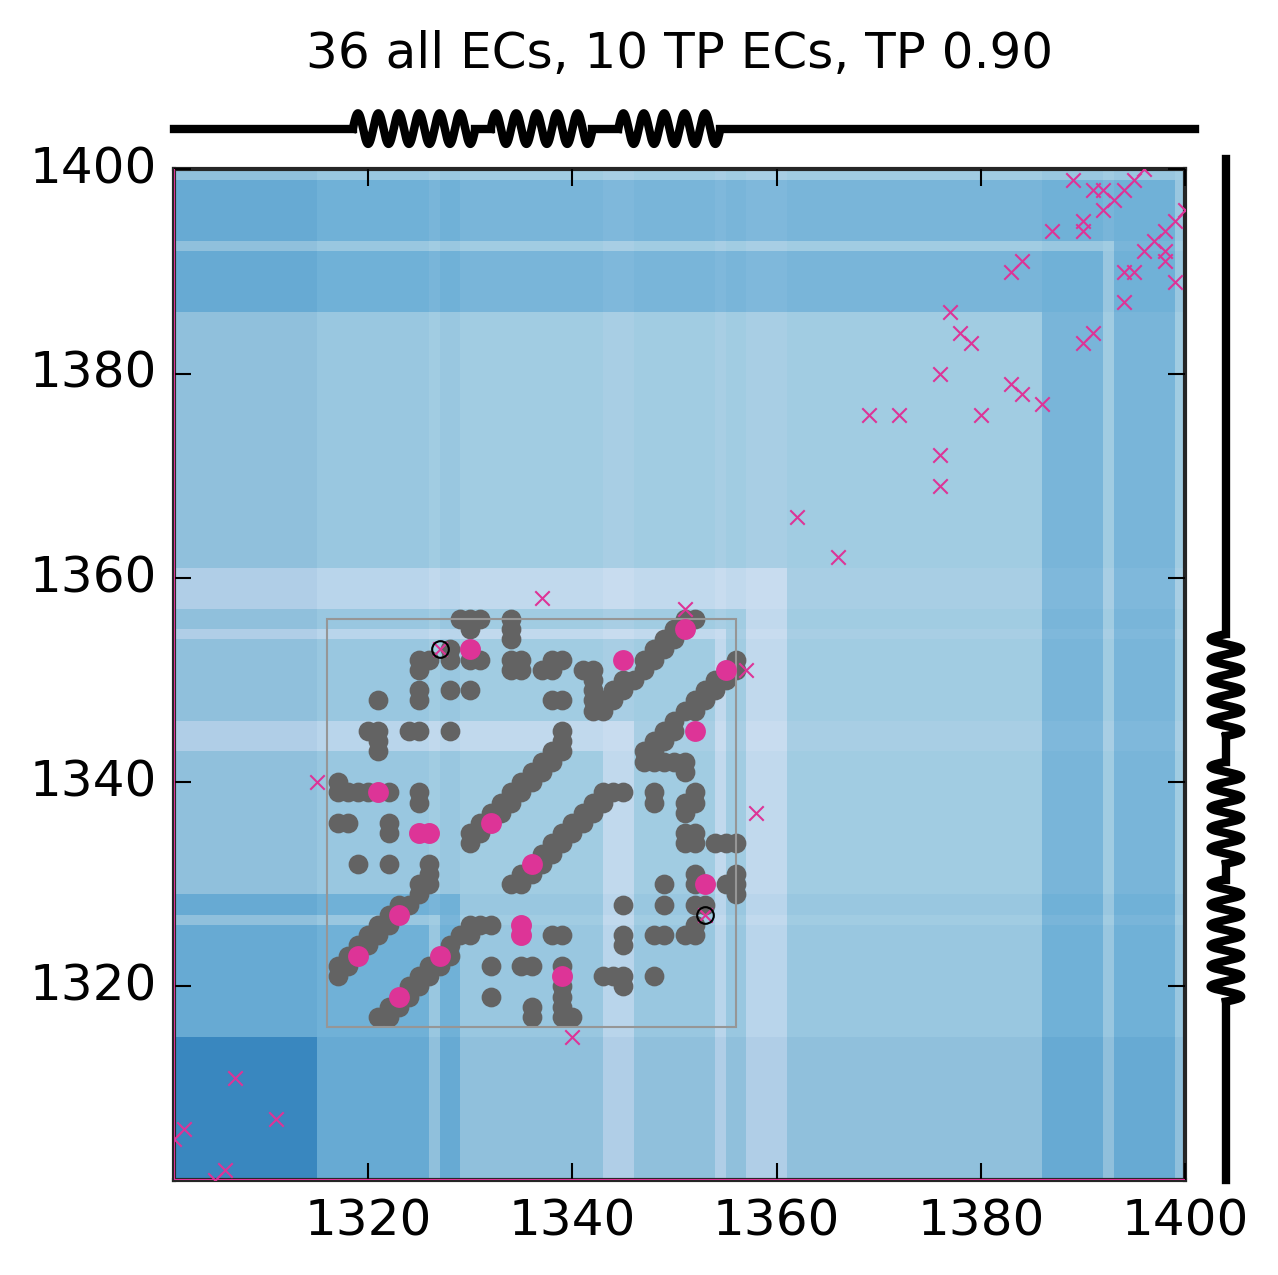
Predicted and experimental contacts
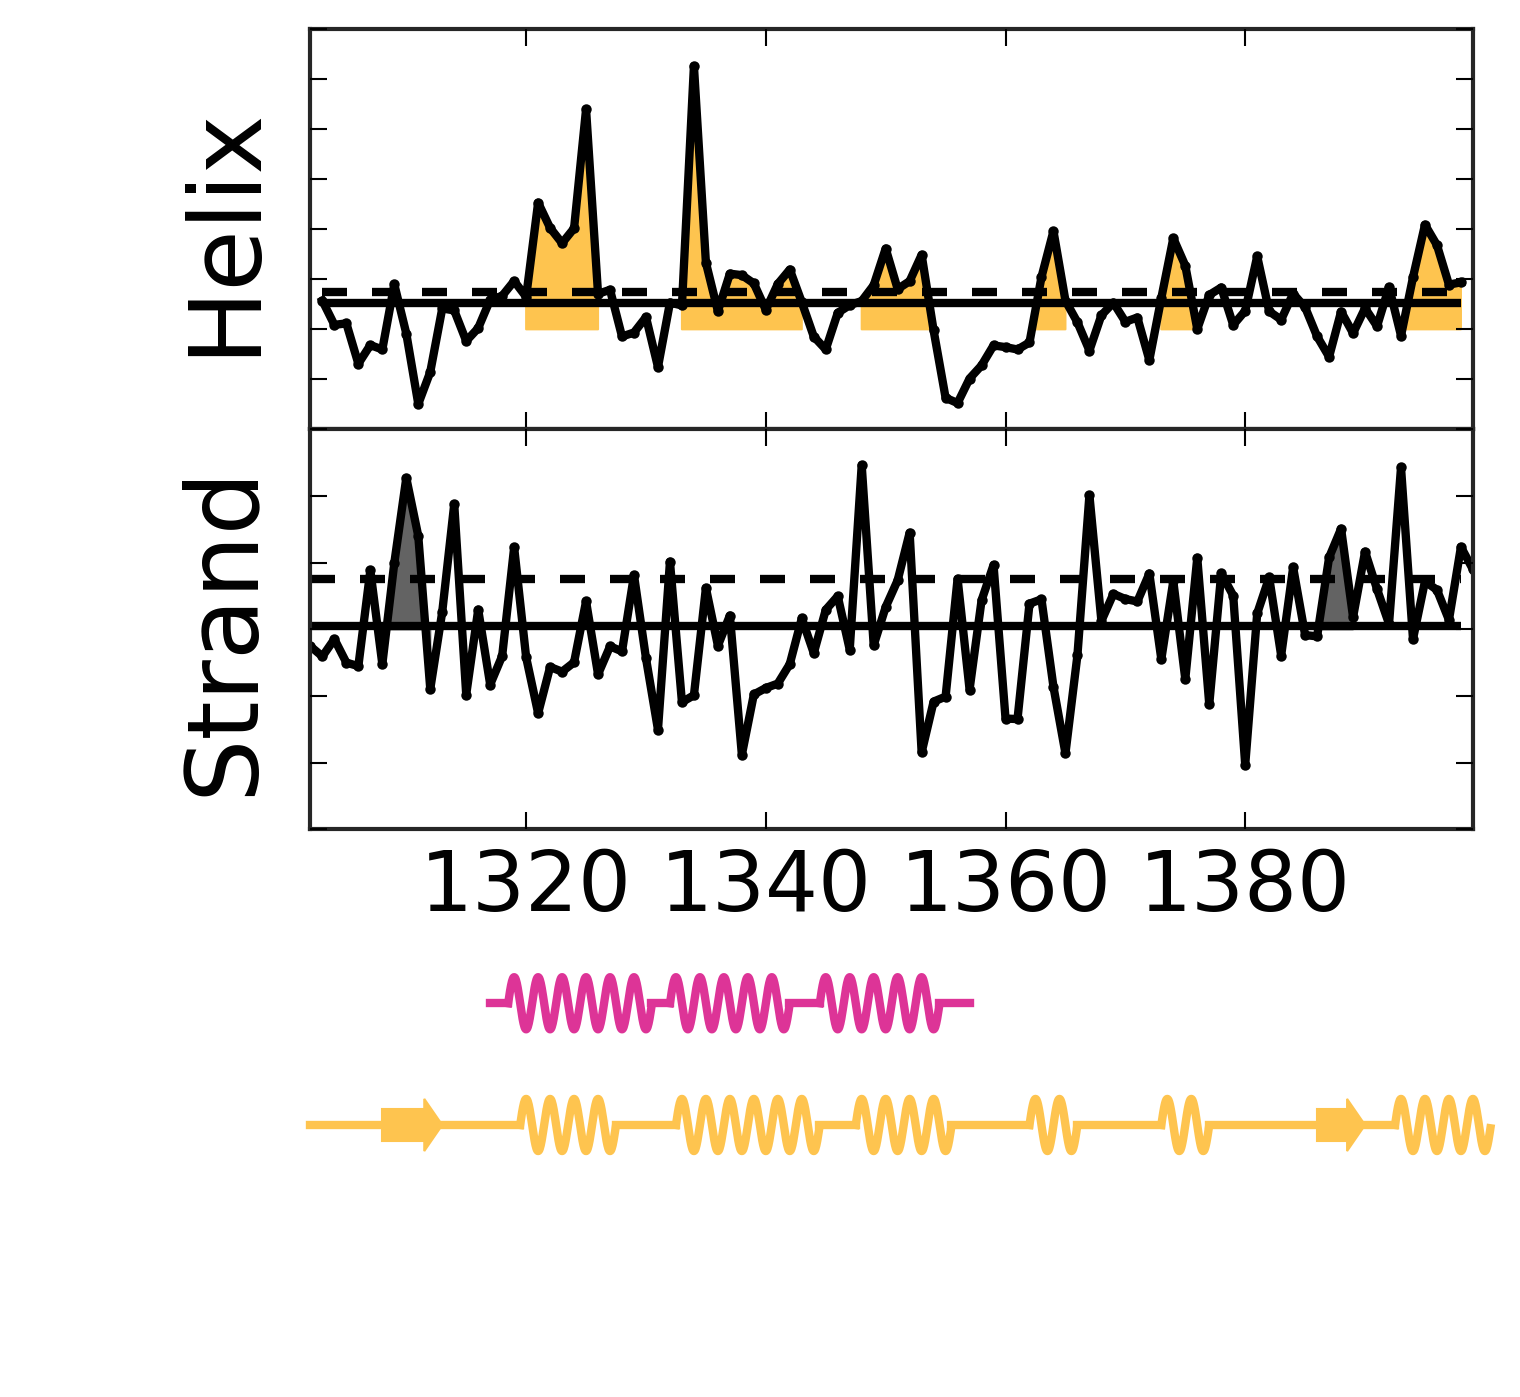
Secondary structure from ECs
EC score distribution and threshold
Top ECs
| Rank |
Residue 1 |
Amino acid 1 |
Residue 2 |
Amino acid 2 |
EC score |
| 1 |
1332 |
R |
1336 |
M |
0.59 |
| 2 |
1330 |
F |
1353 |
L |
0.47 |
| 3 |
1319 |
Q |
1323 |
Q |
0.38 |
| 4 |
1325 |
L |
1335 |
A |
0.38 |
| 5 |
1326 |
M |
1335 |
A |
0.37 |
| 6 |
1384 |
G |
1391 |
Q |
0.36 |
| 7 |
1391 |
Q |
1398 |
E |
0.35 |
| 8 |
1323 |
Q |
1327 |
D |
0.33 |
| 9 |
1327 |
D |
1353 |
L |
0.33 |
| 10 |
1351 |
Y |
1357 |
P |
0.33 |
| 11 |
1393 |
A |
1397 |
E |
0.30 |
| 12 |
1379 |
I |
1383 |
L |
0.30 |
| 13 |
1307 |
E |
1311 |
S |
0.30 |
| 14 |
1321 |
Q |
1339 |
L |
0.28 |
| 15 |
1394 |
E |
1398 |
E |
0.28 |
| 16 |
1369 |
M |
1376 |
M |
0.27 |
| 17 |
1383 |
L |
1390 |
D |
0.27 |
| 18 |
1337 |
E |
1358 |
P |
0.27 |
| 19 |
1390 |
D |
1394 |
E |
0.27 |
| 20 |
1362 |
G |
1366 |
D |
0.27 |
| 21 |
1302 |
E |
1306 |
Q |
0.26 |
| 22 |
1387 |
I |
1394 |
E |
0.26 |
| 23 |
1301 |
E |
1305 |
G |
0.26 |
| 24 |
1392 |
R |
1398 |
E |
0.26 |
| 25 |
1376 |
M |
1380 |
A |
0.26 |
| 26 |
1392 |
R |
1396 |
P |
0.25 |
| 27 |
1315 |
P |
1340 |
L |
0.25 |
| 28 |
1345 |
M |
1352 |
L |
0.25 |
| 29 |
1351 |
Y |
1355 |
H |
0.25 |
| 30 |
1372 |
E |
1376 |
M |
0.25 |
| 31 |
1389 |
M |
1399 |
V |
0.24 |
| 32 |
1378 |
A |
1384 |
G |
0.24 |
| 33 |
1396 |
P |
1400 |
A |
0.24 |
| 34 |
1395 |
S |
1399 |
V |
0.24 |
| 35 |
1377 |
R |
1386 |
D |
0.23 |
| 36 |
1390 |
D |
1395 |
S |
0.23 |
Alignment robustness analysis
First most common residue correlation
Second most common residue correlation